Written by J.A Dobado | Last Updated on April 22, 2024
What is infrared spectroscopy?
Infrared (IR) spectroscopy uses radiation from the electromagnetic spectrum whose wavelength (λ) is between 800 and 400000 nm (0.8 and 400 μ; 1 μ = 10-4 cm).
Therefore, its effect on organic matter is to produce deformations of the bonds of the substance.
Due to its large size, it is usually divided into three zones:
Being IR the technique normally used experimentally in structure determination (2.5 – 16 μ). Thus, due to historical considerations, the most commonly used unit in IR is not the wavelength (λ) but the wavenumber (ṽ = 1/ λ cm-1). Therefore, the IR corresponds to the range between 4000 and 625 cm-1.
On the other hand, the typical appearance of an IR spectrum is as shown in the figure:

Each observable absorption in the spectrum corresponds to a specific vibration of some bond within the molecule.
Bond vibrations
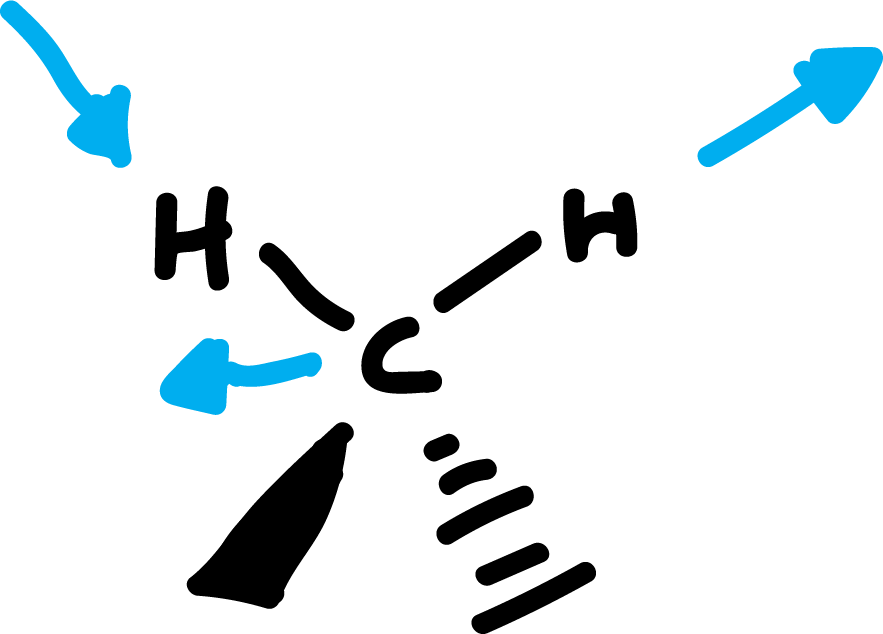
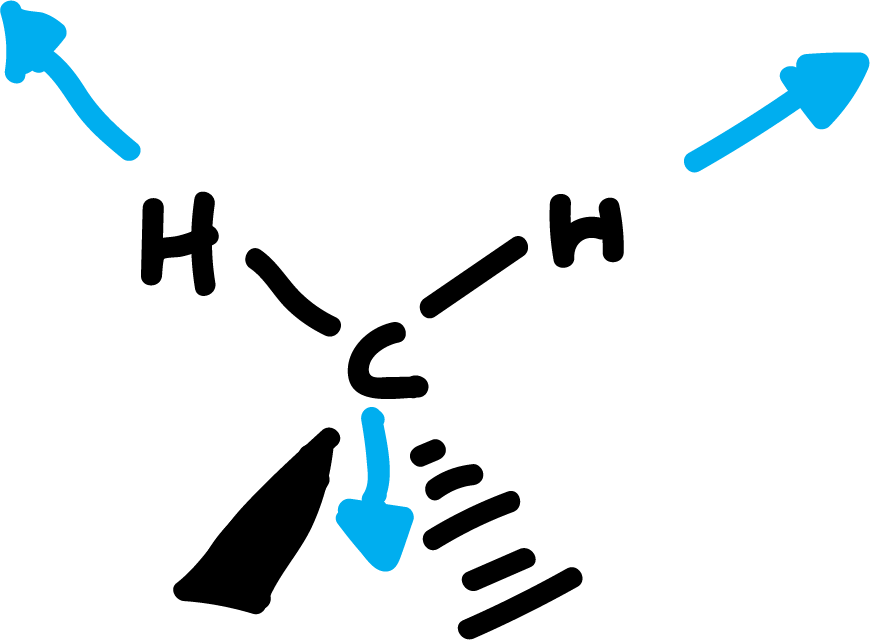
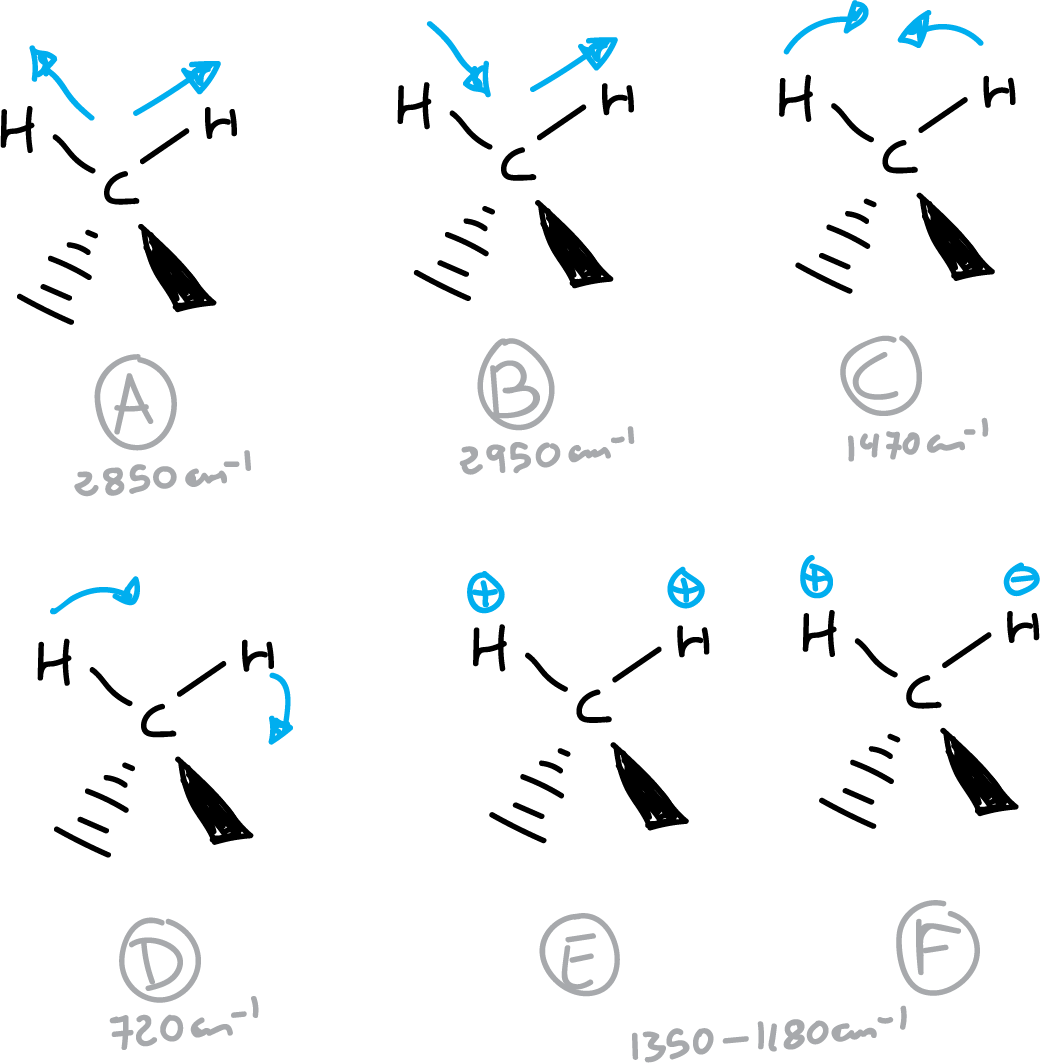
There are different normal modes of vibration in molecules. And these are associated with a characteristic motion of the atoms. The main ones are: bond stretching, valence angle deformations, dihedral angle deformations, out-of-plane deformations, etc.
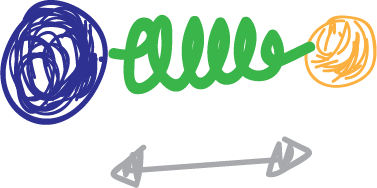
For example, the normal modes of vibration of formaldehyde. Each of these types of vibration has a characteristic frequency associated with it, which can be calculated using Hooke’s equation for vibrational motion:
υ = (1/2π)·√k/mTo (ec. 1)
υ = (1/2π)·√k/u (ec. 2)
where k is the bond strength constant and u is the reduced mass of the system. Depending on the ratio of the masses of the atoms involved in the bond. Thus, we will use equation (1) when mA << mB or (2) when both masses are comparable.
In a molecule with n atoms, 3n-6 tension and bending bands should appear (3n-5 when the molecule is linear).
Thus, of all of them, only those vibrations that produce a change in the dipole moment will give a band observable in the IR (symmetric vibrations do not appear in the IR, but could be observed in Raman spectroscopy).
For example, the vibrational modes of the methylene group will be:
IR spectrum areas
When identifying functional groups with IR spectroscopy we will consider the IR spectrum divided into several areas:
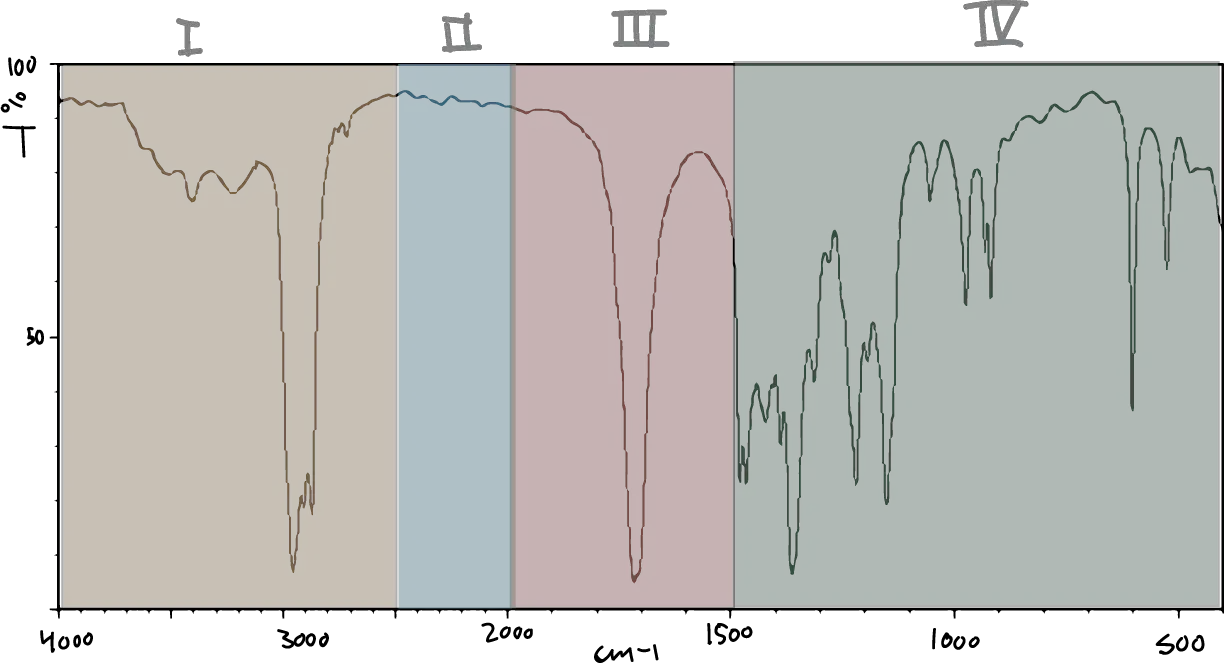
- Area I from 4000 to 2500 cm-1C-H, O-H and N-H bond stretching.
- Area II from 2500 to 2000 cm-1: Strechingt of accumulated triple and double bonds.
- Area III from 2000 to 1500 cm-1: C=O, C=N and C=C stretching.
- Area IV from 1500 to 600 cm-1: Fingerprint area (bending of CH,CO,CN,CC, etc. bonds).
Identification of functional groups in the IR
According to this division, various functional groups can be identified, as shown in Table 1.
| Functional group | Nº de onda (cm-1) |
| OH (without hydrogen bonding) | 3600 |
| NH | 3500-3300 |
| OH (hydrogen bonding) | 3100-3200 |
| -C ≡ C- | 2300-2100 |
| -N=C=O | ~ 2270 |
| -C ≡ N | ~ 2250 |
| -N=C=S | ~ 2150 |
| C=C=C | ~ 1950 |
| Anhydrides | 1850-1740(2) |
| -COCl | 1815-1785 |
| Cyclobutanones | 1780-1760 |
| γ-lactones | 1780-1760 |
| Cyclopentanones | 1750-1740 |
| Esters | 1750-1735 |
| α,β-Unsaturated esters | 1750-1715 |
| δ-Lactones | 1750-1735 |
| Aldehydes | 1740-1720 |
| Ketones | 1725-1700 |
| Carboxylic acids | 1725-1700 |
| α,β-Unsaturated aldehydes and ketones | 1715-1660 |
| Amides | 1690-1630 |
| C=N- | 1690-1480 |
| NO2 | 1650-1500 1400-1250 |
| C-F | 1400-1000 |
| Sulfonamides and sulfonates | 1370-1300 1180-1140 |
| sulfones | 1350-1300 1150-1100 |
| S=O | 1070-1010 |
| C-Br | 800-560 |
| C-Cl | 780-580 |
| C-I | 600-500 |
As we can see, most of the most frequent functional groups in organic chemistry show a characteristic absorption in the IR spectrum.